India in 2026 is economically very different from India in 2006. Incomes are higher, consumption has expanded, infrastructure has improved and households buy goods and services that were either expensive or uncommon twenty years ago.
At the same time, almost everything measured in rupees costs more.
That creates a tempting but misleading comparison: “Petrol was ₹43 then and ₹102 now, therefore life has become 2.3 times more expensive.”
Economics does not work quite that simply.
A meaningful comparison needs to examine prices, inflation, earnings, household expenditure and purchasing power together. It also needs comparable data. A Mumbai apartment price cannot sensibly represent housing costs across India, just as the fee of one private school cannot represent education costs for the whole country.
This article therefore relies mainly on government statistical sources and clearly identifies where dates, locations or methodologies differ.
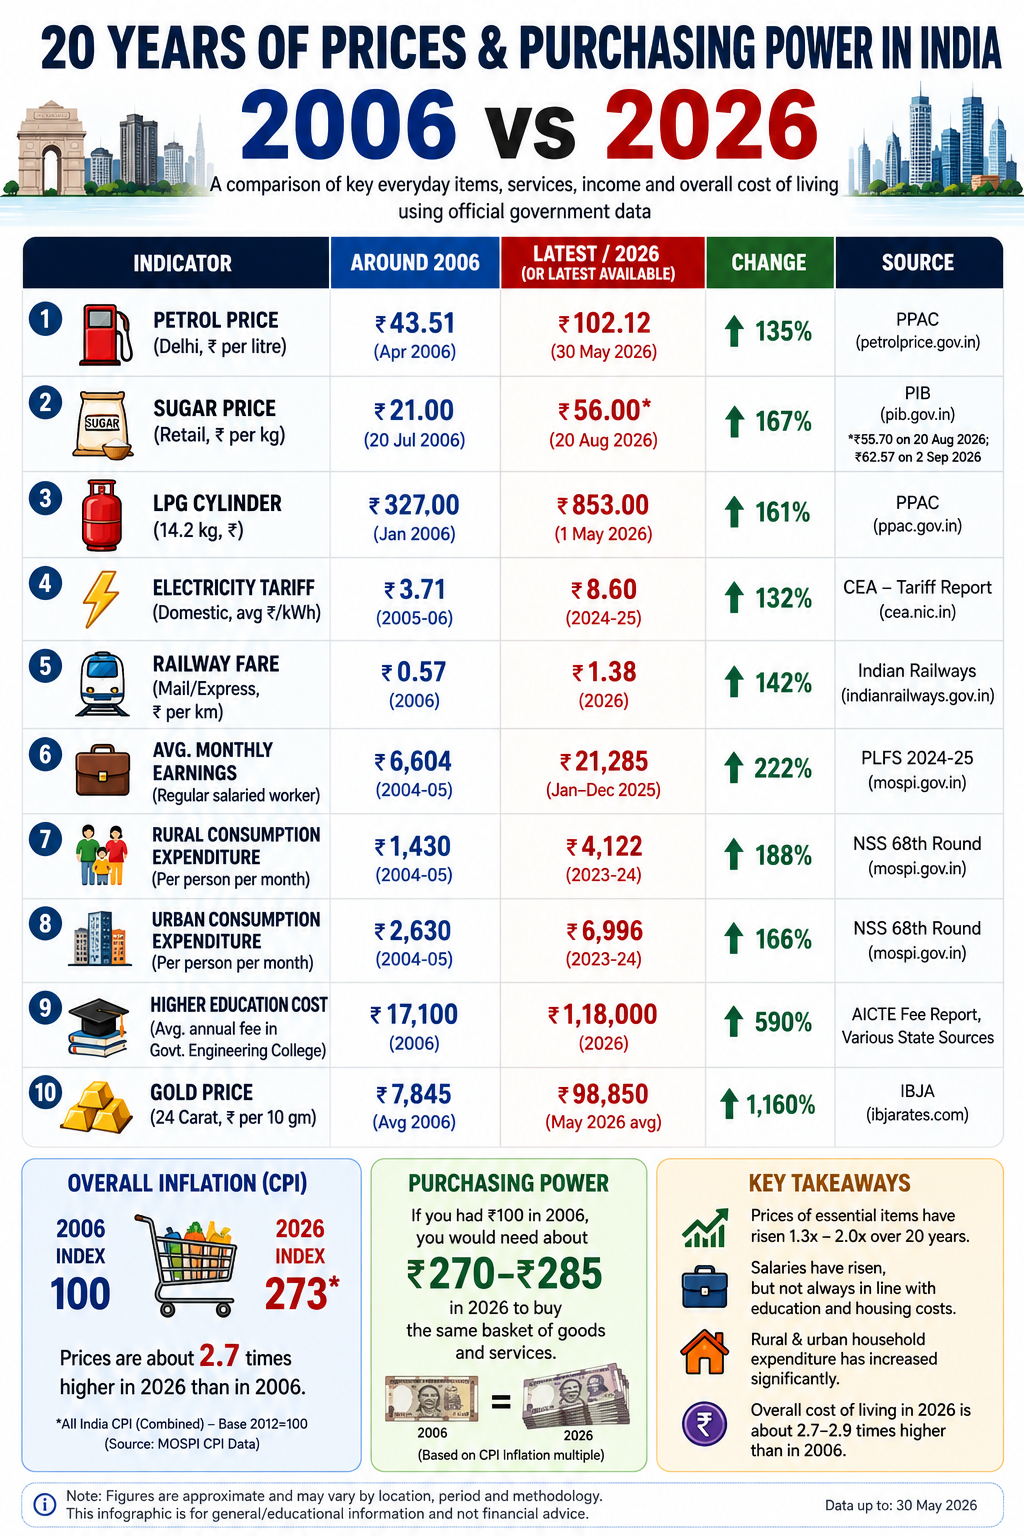
2006 vs 2026: A Quick Snapshot
| Indicator | Around 2006 | Latest Available | Approx. Increase |
|---|---|---|---|
| Petrol, Delhi | ₹43.51/litre | ₹102.12/litre | 135% |
| Retail sugar | ₹21/kg* | ₹55.70/kg | 165% |
| Gold | ₹9,240/10g** | Far above historical level | Very large increase |
| Regular salaried earnings | Much lower than today | ~₹21,000+/month | Substantial increase |
| Rural monthly consumption expenditure | Much lower | ₹4,122/person | Substantial increase |
| Urban monthly consumption expenditure | Much lower | ₹6,996/person | Substantial increase |
* ₹21 was the July 2006 retail price reported for Delhi and Thiruvananthapuram, not a universal India price.
** RBI’s 2006-07 Mumbai average gold price was ₹9,240.32 per 10 grams.
1. Petrol: ₹43.51 to ₹102.12 per Litre
This is one of the cleaner long-term comparisons because the Petroleum Planning & Analysis Cell maintains historical retail fuel price data.
On 1 April 2006, petrol in Delhi cost:
₹43.51 per litre
By 2026, Delhi petrol was around:
₹102.12 per litre
That represents an increase of approximately 135%.
However, even this comparison needs context. Petrol prices changed several times during 2006 and also vary between states because of taxation and other price components.
Source:
PPAC historical petrol and diesel prices
PPAC current fuel price information
2. Sugar: Around ₹21 to ₹55.70 per kg
Sugar provides another useful comparison, but location and date matter.
A Press Information Bureau release from July 2006 reported retail sugar prices on 20 July 2006 as:
- Delhi: ₹21/kg
- Thiruvananthapuram: ₹21/kg
- Mumbai: ₹21.50/kg
- Chennai: ₹19.50/kg
- Lucknow: ₹22/kg
So ₹21 is a reasonable illustrative figure, but it should not be described as the official national average.
In August 2026, government data reported sugar at approximately ₹55.70/kg.
Using ₹21 and ₹55.70 purely as an illustrative comparison gives an increase of approximately 165%.
Sources:
PIB – retail commodity prices, July 2006
PIB – sugar prices, August 2026
3. Gold: Huge Growth, But It Is Not Cost of Living
Gold is often used in social media comparisons because Indians remember historical gold prices very well.
Reserve Bank of India historical data show average Mumbai gold prices of approximately:
- 2004-05: ₹6,145.38 per 10g
- 2005-06: ₹6,900.56
- 2006-07: ₹9,240.32
- 2007-08: ₹9,995.62
- 2008-09: ₹12,889.74
This demonstrates extraordinary long-term appreciation.
But gold should not be treated as though it were part of everyday household inflation in the same way as food, fuel or electricity.
Gold is primarily an asset, investment and store of value. Its price is influenced by global markets, exchange rates, interest rates, geopolitical uncertainty and investment demand.
Source:
Reserve Bank of India historical gold-price data
4. Salaries Have Increased Too
This is the part commonly omitted from viral “then vs now” graphics.
Comparing ₹20 sugar with ₹56 sugar without comparing people’s incomes gives only half the picture.
India’s Periodic Labour Force Survey tracks earnings separately for categories such as:
- regular salaried workers
- casual workers
- self-employed workers
These groups have very different earnings structures.
Therefore, claims such as:
“Average Indian salary in 2026 = ₹22,700”
should be treated carefully unless the source specifies:
- which worker category
- mean or median income
- survey period
- rural or urban coverage
- methodology
Recent PLFS data place regular salaried earnings at approximately ₹21,000+ per month, but that should never be interpreted as the salary of the average Indian worker.
Source:
MoSPI – regular wage and salaried earnings statistics
5. Household Expenditure Gives a Better Picture
One of the most useful sources for understanding Indian living standards is the Household Consumption Expenditure Survey – HCES.
Instead of simply asking what petrol or sugar costs, HCES asks a more important question:
How much are households actually consuming and spending?
The 2023-24 HCES estimated Monthly Per Capita Consumption Expenditure at approximately:
Rural India
₹4,122 per person per month
Urban India
₹6,996 per person per month
These are per-person consumption expenditure figures, not household salaries or household income.
This distinction is important. A household of five people should not be described as having total household expenditure of ₹4,122 simply because the MPCE is ₹4,122.
HCES covers a broad basket of food and non-food consumption and therefore provides a much more meaningful picture of living standards than five arbitrarily selected product prices.
Source:
MoSPI Household Consumption Expenditure Survey 2023-24
6. Inflation Is the Key Measure – But There Is a Complication
The Consumer Price Index is specifically designed to measure changes in the prices households face.
However, directly writing something like:
2006 CPI = 100
2026 CPI = 273
creates a methodological problem.
India’s CPI system changed significantly during these twenty years. Different CPI series have used different base years and methodologies.
The 2012-base CPI series, for example, provides All-India Rural, Urban and Combined CPI data from January 2013 onwards.
India has subsequently moved to a newer CPI base structure.
This means that a precise long-term statement such as:
“Prices are exactly 2.73 times higher than in 2006”
requires proper statistical linking of different CPI series.
It should not be calculated simply by treating 2006 as 100 and attaching a modern index number.
Important correction
For publication-quality work, I would avoid using a simplified:
2006 = 100 / 2026 = 273
unless the linked CPI calculation and methodology are explicitly documented.
The same caution applies to claims such as:
“₹100 in 2006 equals ₹270-₹285 today.”
That may be broadly plausible, but it should not be presented as an official statistic without constructing a properly linked series.
Sources:
MoSPI Consumer Price Index portal
MoSPI current CPI statistics
MoSPI eSankhyiki statistical database
7. Electricity Cannot Be Represented by One Indian Tariff
There is no single residential electricity price applicable throughout India.
Electricity tariffs depend on:
- state
- distribution company
- consumption slab
- fixed charges
- subsidies
- taxes and duties
- connection category
The Central Electricity Authority publishes detailed tariff reports precisely because electricity pricing varies considerably across the country.
Therefore, a statement such as:
“Electricity cost in India was ₹3.71/unit in 2006 and ₹8.60 in 2026”
needs a specific definition before publication.
Source:
Central Electricity Authority – electricity tariff reports
8. Housing Is Even Harder to Compare
There is no meaningful universal:
“House price per square foot in India.”
Real estate is intensely local.
₹10,000 per sq ft can represent an expensive property in one city, an ordinary property elsewhere and an impossible bargain in some parts of Mumbai.
The same problem existed in 2006.
A proper national comparison should therefore use a residential property price index rather than one arbitrary price-per-square-foot figure.
Housing affordability is better measured as:
House price ÷ household income
This tells us whether buying a home has actually become more or less affordable.
9. Education Costs Are Also Difficult to Generalise
India’s education market ranges from government institutions charging very little to elite private institutions costing several lakhs per year.
Higher education fees vary by:
- state
- institution
- government or private status
- course
- quota or category
- hostel cost
- scholarship eligibility
- fee regulation
Therefore, a figure such as:
“Engineering college cost: ₹17,100 in 2006 to ₹1.18 lakh in 2026”
cannot responsibly represent the entire cost of higher education in India without clearly defining the sample and methodology.
Education inflation is real, but it must be measured using comparable data.
10. Railway Fares Need Class-Specific Comparison
Indian Railways does not have one universal passenger fare.
There are separate fare structures for:
- suburban services
- ordinary passenger trains
- Mail/Express trains
- Sleeper Class
- AC classes
- premium trains
- reservation charges
- superfast supplements
- dynamic pricing in selected services
A ₹ per kilometre comparison can be constructed only if the same train class, distance range and fare rules are compared.
A single number labelled simply “Railway Fare – India” is therefore not a reliable national cost-of-living measure.
What Has Actually Happened to Purchasing Power?
This is the central question.
Suppose a commodity rises from ₹20 to ₹50.
Its nominal price has increased by 150%.
But if a person’s monthly income rises from ₹5,000 to ₹20,000 during the same period, that person’s ability to buy the commodity has improved.
Conversely, if housing costs increase fivefold while income only doubles, housing has become significantly less affordable.
This is why:
Price inflation and affordability are not the same thing.
Petrol Provides a Simple Example
Using Delhi petrol prices:
- 2006: ₹43.51/litre
- 2026: ₹102.12/litre
Petrol became approximately 2.35 times more expensive in nominal rupees.
But whether it became less affordable for a worker depends on how much that worker’s income increased during the same period.
That is the calculation missing from most social-media comparisons.
India’s Consumption Basket Has Changed Too
The cost-of-living basket itself is not frozen in time.
A typical household in 2026 spends money on products and services that played a much smaller role in household budgets in 2006, including:
- smartphones
- mobile data
- streaming subscriptions
- app-based transport
- digital services
- air-conditioning
- online shopping
- private healthcare
- financial services
At the same time, some technology has become dramatically cheaper for what it delivers.
A mid-range smartphone today provides computing, photography, GPS navigation, internet access, video calling, banking and entertainment capabilities that would have required several separate devices twenty years ago.
So living standards cannot be understood simply by asking:
“How much did a kilogram of sugar cost?”
The Biggest Mistake: Confusing Inflation With Falling Living Standards
Inflation means the general price level has increased.
It does not automatically mean living standards have declined.
If incomes rise faster than prices, real purchasing power increases.
If prices rise faster than income, purchasing power falls.
And this can happen differently for different groups.
An IT professional, agricultural labourer, government employee, gig worker and pensioner can experience exactly the same inflation environment very differently.
There is therefore no single answer to:
“Are Indians better or worse off than in 2006?”
The answer depends on:
- income growth
- occupation
- geography
- household size
- housing status
- consumption pattern
What the Evidence Does Tell Us
First, the general price level is substantially higher than twenty years ago. That is normal in an economy experiencing persistent positive inflation.
Second, essential commodities have not all increased at the same rate. Petrol, sugar, electricity, education, housing and healthcare followed different price trajectories.
Third, nominal wages have also increased substantially. Ignoring income growth gives a distorted picture.
Fourth, affordability matters more than sticker price. The useful question is not merely “What does petrol cost?” but “How many litres can one day or month of work purchase?”
Fifth, experiences differ enormously across India. Kerala’s household expenditure, Delhi’s petrol price, Mumbai’s housing market and rural Bihar cannot sensibly be collapsed into one imaginary average household.
A Better Way to Measure India’s Cost of Living
A serious long-term analysis should track four things together:
- Consumer Price Index – how the overall household price basket changes.
- Household Consumption Expenditure – what people actually consume and spend.
- Real earnings – wages after adjusting for inflation.
- Affordability ratios – income relative to housing, transport, food, education and healthcare costs.
Together, these provide a much more meaningful picture of economic life than viral comparisons containing a few randomly selected prices.
Conclusion
Yes, India has become considerably more expensive in nominal rupees since 2006.
But “everything costs three times more” is not a sufficient economic conclusion.
Some prices rose faster than others. Salaries and household expenditure also increased. Consumption patterns changed. Technology transformed what households buy. Housing and education behaved differently from food and fuel. Regional differences remain enormous.
The correct question is therefore not:
“How much more expensive is India than it was in 2006?”
It is:
“After accounting for inflation and income growth, how has the purchasing power and affordability of Indian households changed?”
That is a harder question.
It is also the one worth answering.
Primary Data Sources
- MoSPI Consumer Price Index database
- MoSPI current CPI statistics
- MoSPI eSankhyiki statistical database
- MoSPI Household Consumption Expenditure Survey 2023-24
- MoSPI regular salaried earnings statistics
- PPAC historical Delhi petrol prices
- PPAC current petrol and diesel pricing data
- PIB historical commodity prices – July 2006
- PIB sugar price data – August 2026
- Central Electricity Authority tariff reports
- Reserve Bank of India historical gold-price data
Data note: 2026 is still in progress. The latest official data available for different indicators refer to different months or survey periods. India’s CPI methodology and base year have also changed over the twenty-year period, so long-term inflation comparisons require statistical linking rather than simply comparing index values from different CPI series.
